 Next
Previous
Home Next
Previous
Home
|
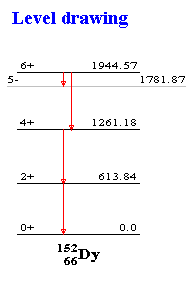
Isotope Explorer can plot nuclear decay schemes in the traditional way. If bands are selected, the decay scheme is plotted as a band plot, as is shown in the figure. In band plots the attributes of gamma-rays (energy, intensity, etc.) are shown in the status bar when the cursor is on top of the gamma. |
